
This post looks into the US solar energy technical potential and actual production by state. We will plot the data in a visually appealing form of choropleth maps with plotly and python. The solar technical potential data can be found here. The link actually contains technical potential data for all the renewable sources of energy including solar PV, concentrating solar power (CSP), onshore & offshore wind power, biopower and more. We've only used the total solar PV data for our analysis which consists of urban utility-scale PV, rural utility-scale PV and rooftop PV. The PDF file available on the linked page above goes into a detailed description of the data, here we would just address what does "technical potential" mean. As defined in the study published on data.gov, the solar technical potential is the achievable energy generation given the system performance, topographic limitations, environmental and land use constraints. In other words, it is an upper-limit estimate of solar power generation theoretical capacity given the natural constraints.

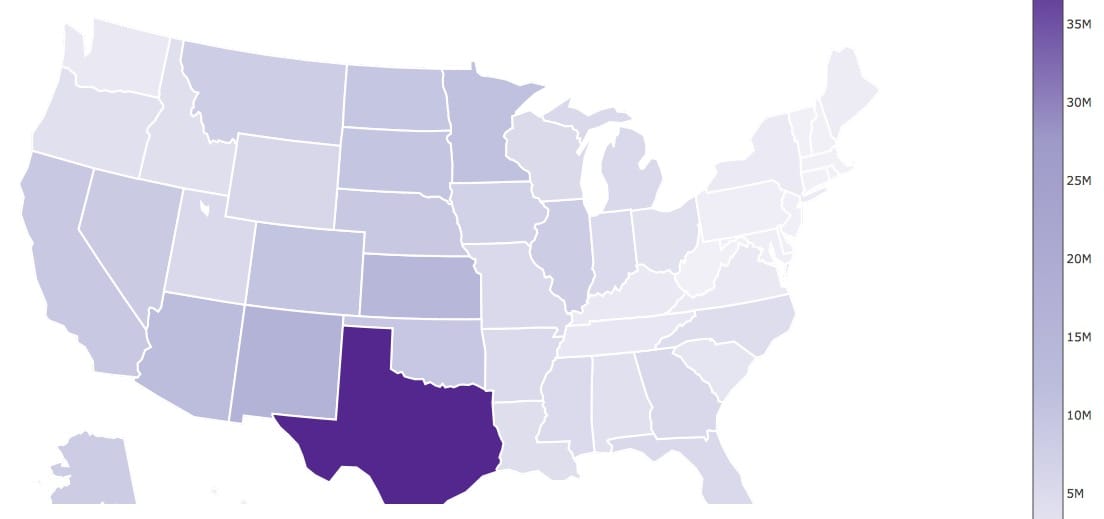
You can notice from the graph that Texas has the highest solar potential owing to the fact that it is the largest southern state in the US. Among other states with high potential are New Mexico, Kansas, Arizona, Oklahoma, Colorado, California.
Next, let's look at what the US actual solar energy generation was in 2017 using the data from eia.gov. The data includes total solar energy production (utility-scale and rooftop PV) by all sectors. Here's the choropleth map

The best performing states immediately jump into the view on this map. The top 4 solar energy producer states are California (34 958 GWh), Arizona (6 834 GWh), North Carolina (5 300 GWh), Nevada (4 558 GWh). The graph makes it obvious just how far ahead California is in terms of solar energy production compared to the other states.
Finally, let's combine the results from the 2 previous maps and calculate the percentage of solar potential each state did actually leverage in 2017.

Here we see a totally different picture. The top 5 leading states in terms of leveraging their solar energy potential are Hawaii (2.74%), Massachusetts (2.1%), Connecticut (1.32%), New Jersey (0.52%), and California (0.38%). Vermont comes close to California with 0.37%.

Comments